My name is Daniel Beckwith. I work as a software engineer at
Tulip Interfaces and I live in
Somerville, Massachusetts.
I've always had a passion for creative and
exploratory coding. The process of coaxing a computer
into executing a procedure that emulates some concept I want to
understand deeper is endlessly satisfying to me. This website documents
some of the projects I've undertaken.
Followers (2025)
tags:
art
visual
simulation
particles
chaos
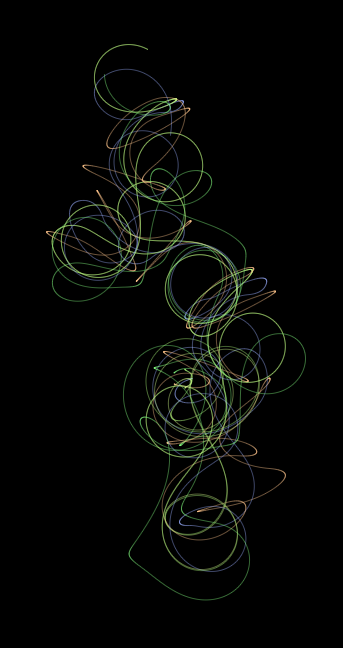
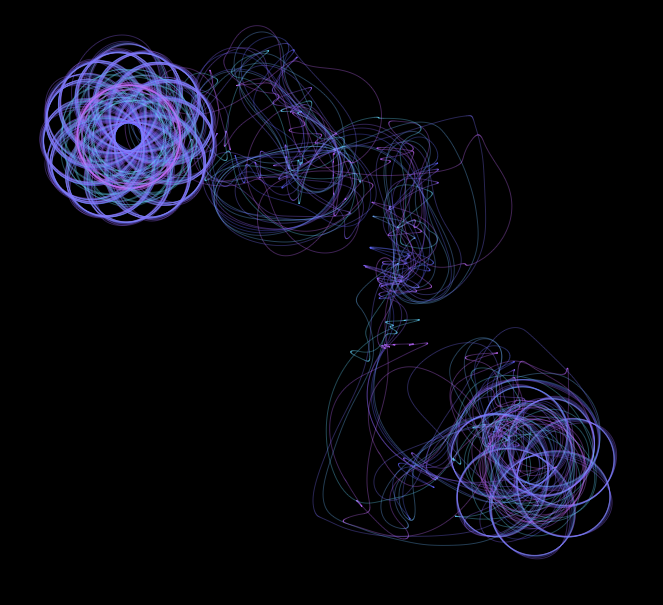
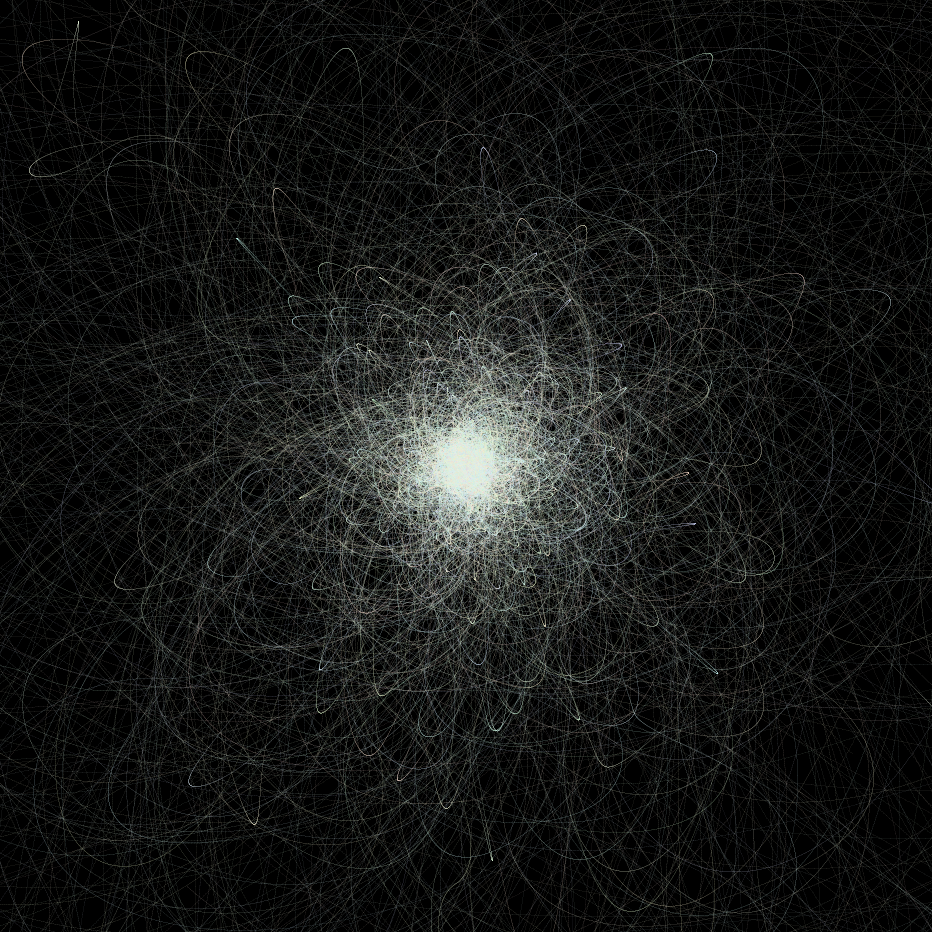
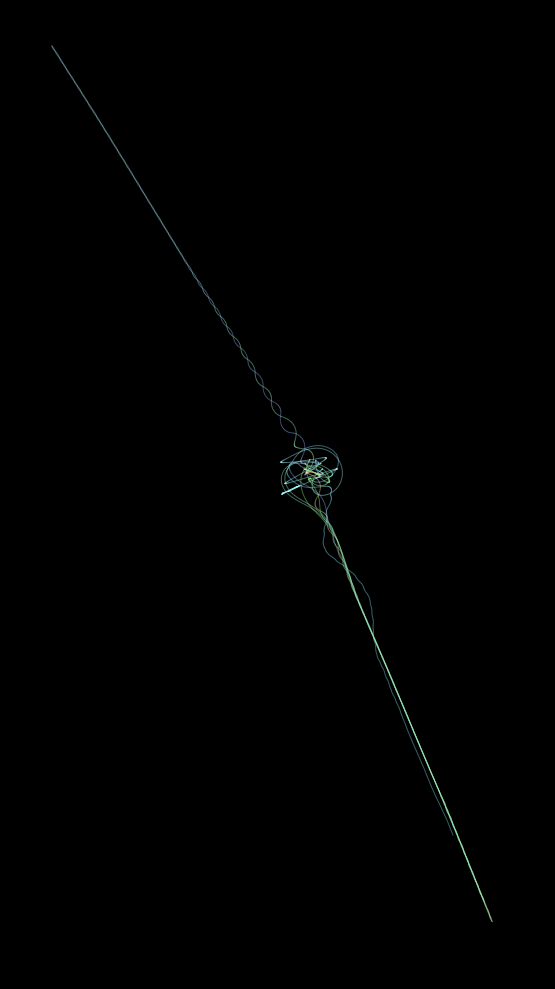
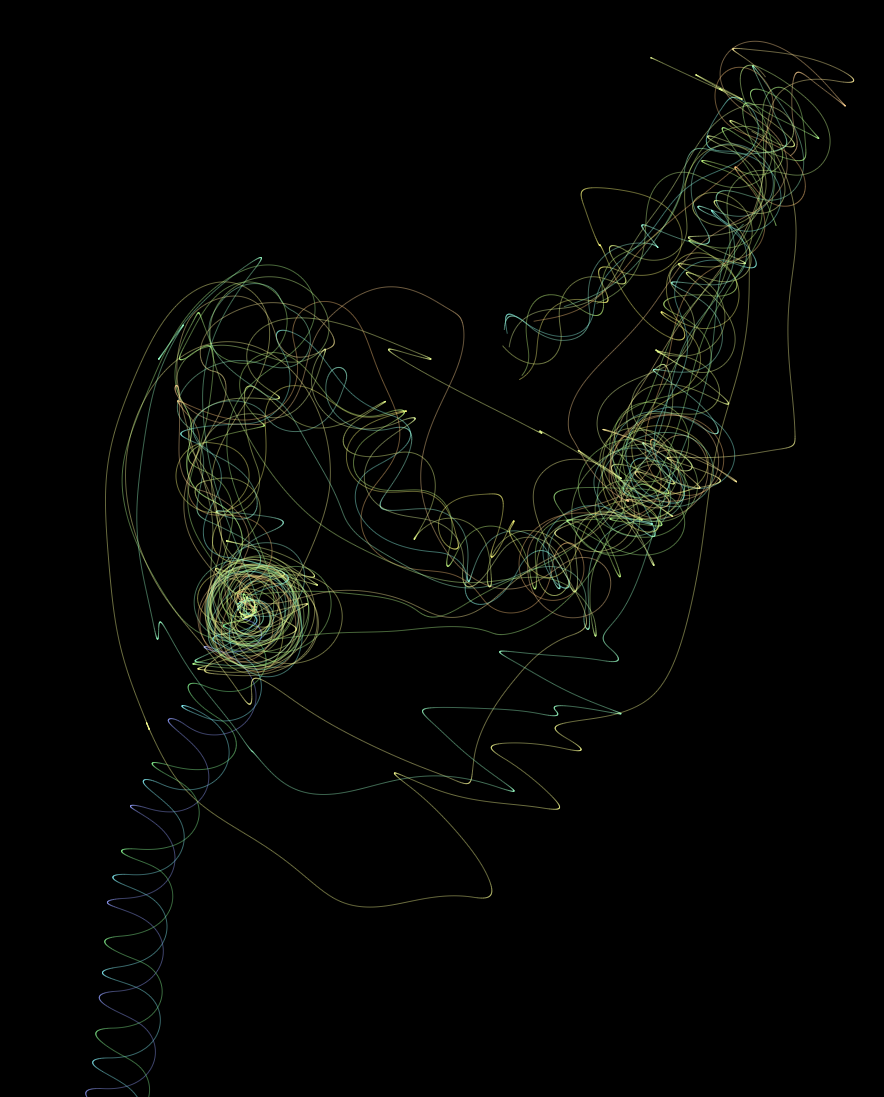
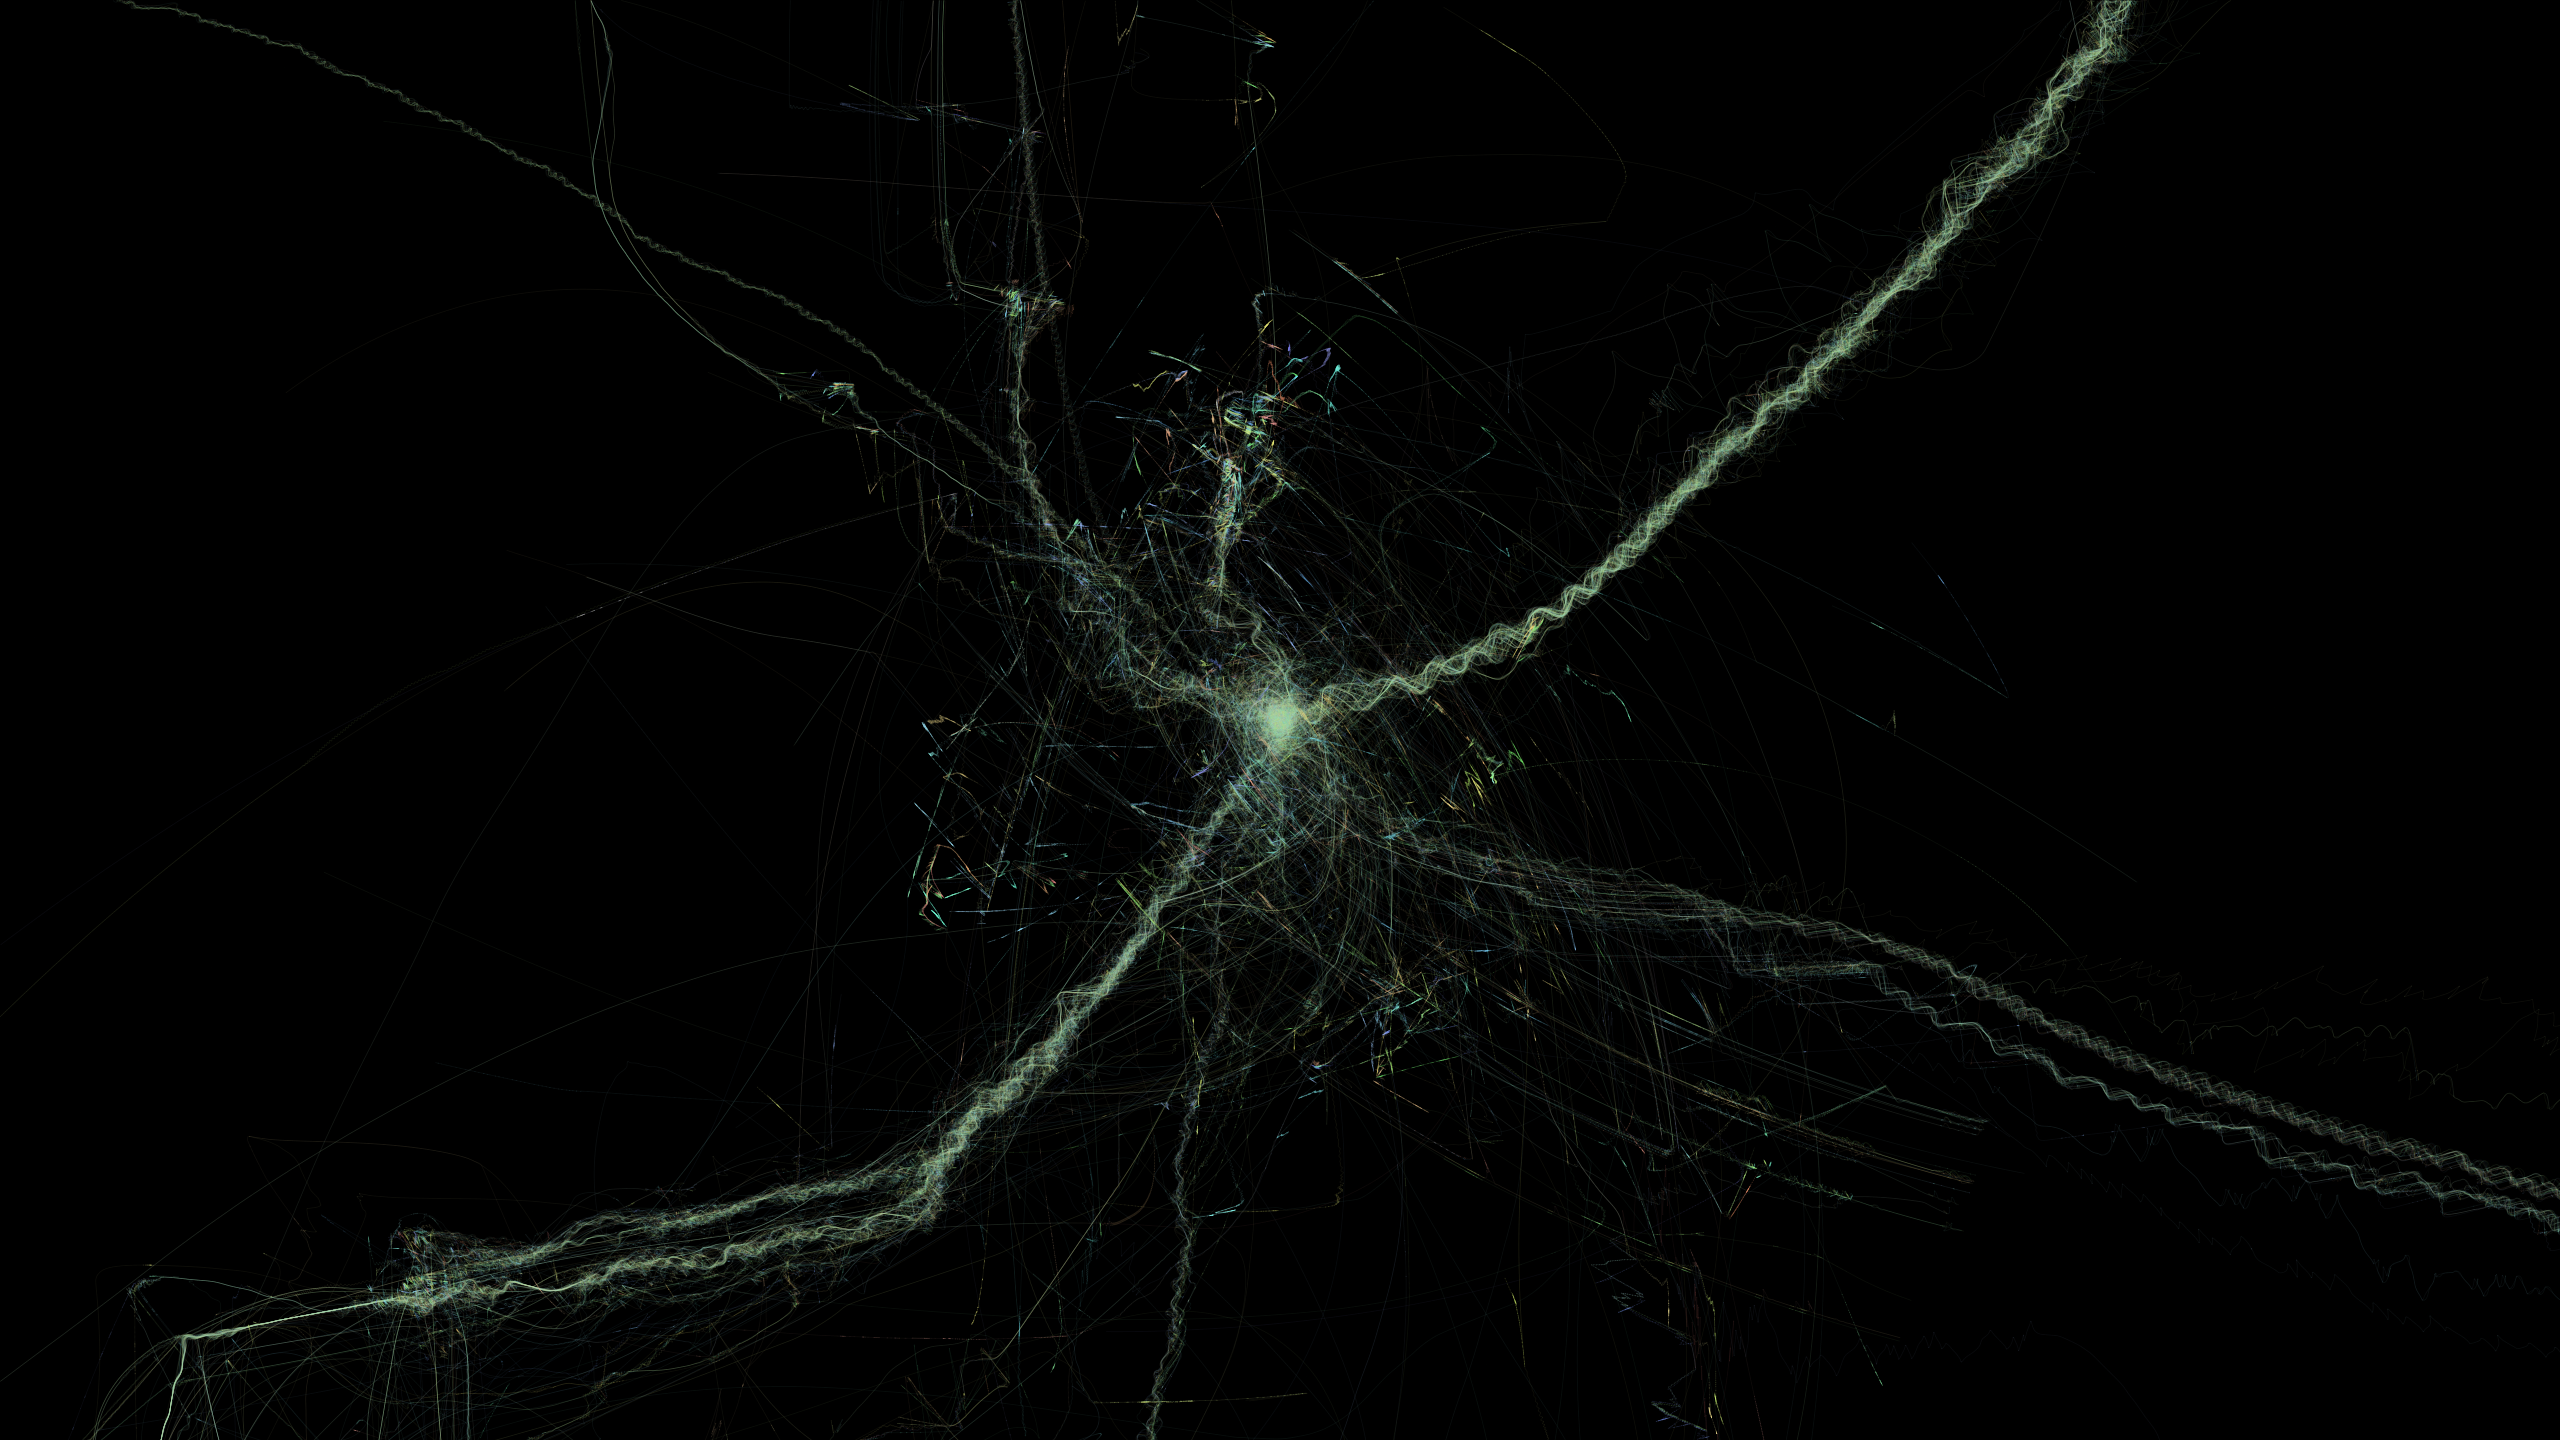
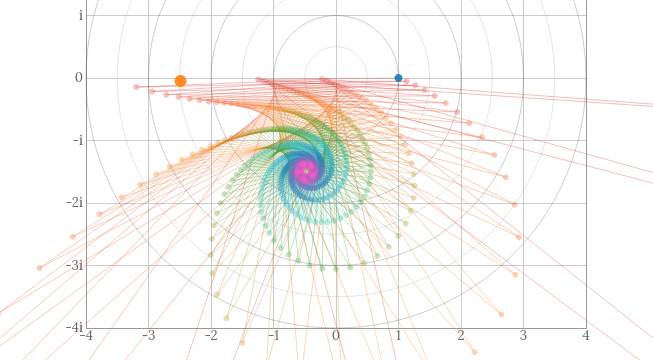
An art project which produces images of swirling chaotic figures based
on a simple dynamic simulation.
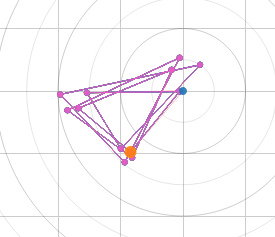
The positions of many particles are traced over time to produce
winding, intersecting trails. The particles move by targeting a
particular position and heading for it. The target position is
determined using the location of two other randomly chosen particles,
or "partners". The target position lies "behind" the first partner on
the line connecting the first partner to the second partner. Partners
are chosen randomly, so the number of particles and the seed value
product different networks of partners, which can produce a large
variety of chaotic cyclic interactions. Simulation parameters such as
the maximum acceleration of the particles, particle count, and initial
particle positions also affect the result. The simulation is run until
a set iteration count is reached. Finally the resulting image of the
traced particle paths can be downloaded as a PNG or SVG.
This project was a good way for me to test out using
Rust in the browser. Rust is
my favorite programming language, and the fact that I can use it to
build apps like this targeting
WASM for the web is amazing.
It uses Dioxus to render the UI
and the
Canvas Web API
to render the image.
Graphs (2015)
tags:
tool
visual
math
A tool for creating node-and-edge graphs and exploring their various
mathematical properties.
I made this app while taking a course on
Graph Theory
in school. Coding it helped me understand the different properties of
graphs on a deeper level, and being able to quickly modify graphs and
see how that affected their properties gave me a better intuitive
sense of what those properties were measuring.
Iterated Functions (2015)
tags:
visual
math
chaos
A simple visualization of how various complex-valued functions evolve
under iteration (feeding their output back to their input repeatedly).
After learning about how fractals such as the
Mandelbrot set
are made from iteration of complex-valued functions, I decided I
wanted a better way to visualize the path that that iteration actually
takes. This app lets you explore the iteration for various interesting
complex-valued functions, all of which could be used to render a
fractal as well.